Bernhard Krabina and Robert Blöschl, KDZ Centre for Public Administration Research Austria
Relevance of the Practice
Transparency in municipal finances is nothing new in Austria. However, sometimes looking up spending reports must be done in person at the city hall. Especially bigger cities have therefore published spending reports and planned budgets on their website, but data is often locked up in PDF documents, and thus not machine readable, which makes it more difficult to use in analysis or for the creation of data visualizations. Rural municipalities tend not to publish spending reports at all on their websites, even though a regulation exists that requires them to do so.[1] Therefore, the only way for citizens of rural areas to inform themselves about municipal spending is to visit municipal offices in person where they can have a look at printouts of the spending reports.
In Austria, the municipalities have to report their budgets to the Länder, which deliver these reports to Statistics Austria (the federal statistics office), where they are aggregated and quality checked. An electronic dataset of all the spending data can be purchased at Statistics Austria, who agreed on making this data available to Open Spending Austria in case the individual municipality consents.
With more than 20,000 of the 27,000 datasets on the Austrian open data portal data.gv.at, Open Spending Austria is by far the largest data publisher. From the published data, several interactive visualizations are provided to inform and educate citizens, journalist, researchers, public officers and politicians.
Description of the Practice
In October 2013, the Centre for Public Administration Research (KDZ) launched an open spending portal in Austria holding the spending data of all 2,100 municipalities at www.offenerhaushalt.at. Each mayor has been sent login credentials enabling him or her to view and explore their own municipality’s spending data from 2001 and with a few clicks release all data and visualizations on the portal for everyone to see and use.
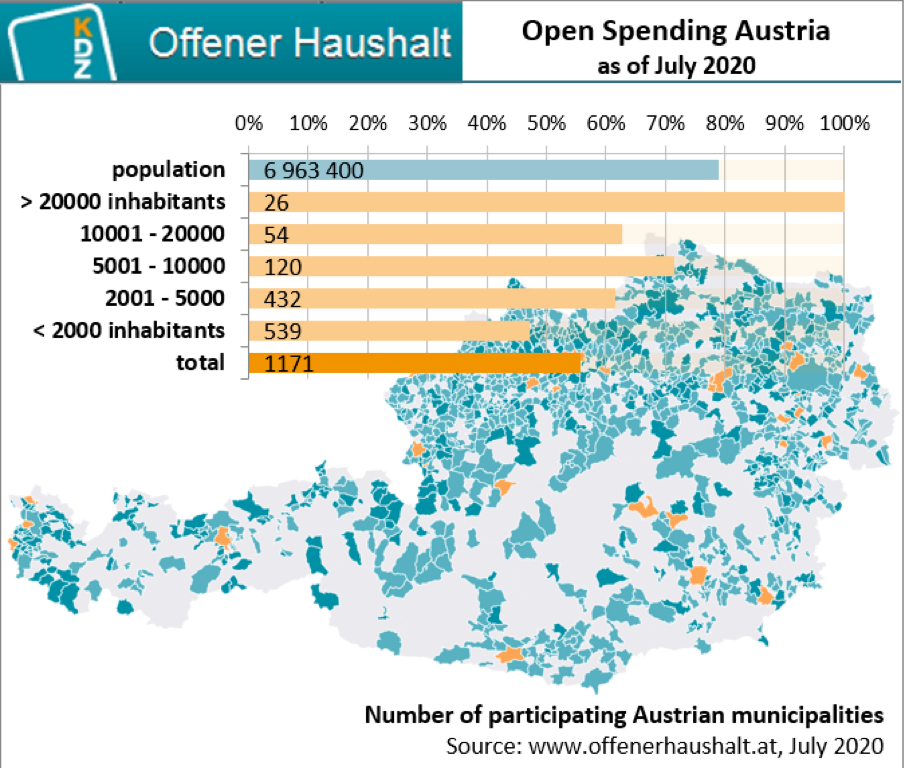
After seven years of operation, Austria’s award winning Open Spending portal covers 56 per cent of all municipalities, representing almost 80 per cent of the population. An analysis of the size of municipalities participating shows that the larger the municipality, the more likely they are participating: 100 per cent of the cities with 20,000 and more inhabitants are on the platform, while only 47 per cent of rural municipalities with less than 2,000 inhabitants are taking part.
The portal not only makes spending data available online, it also provides several types of interactive data visualizations that make it easier for both local government officials and citizens to understand municipal budgets. The main features available for each municipality are:
- tree map of spending data according to political (functional) classifications (i.e., where does the money go?) including the corresponding economic classifications (i.e., what are the types of expenses?);
- line chart with detailed view of the budgets over a 19-year timeline;
- line chart of the debts and liabilities;
- donut chart of the use of EUR 1,000 of tax money;
- KDZ Quick Test: a systematic approach of the financial soundness of the municipality according to 5 sub-indicators displayed in bar charts;
- the ability to download spending data for each year in CSV format for further reuse (CC-BY license);
- the ability to compare certain budget categories across municipalities (for those whose data is also published and only for logged-in users).
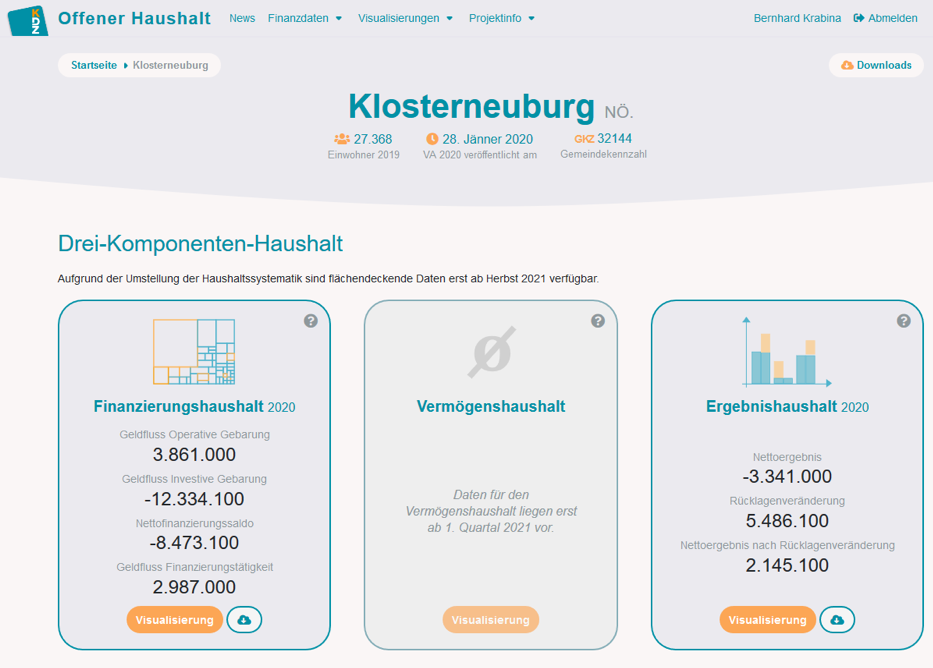
The introduction of the accrual accounting system in Austria as of 2020 made it necessary to implement a major relaunch of the platform. As data currently is only available for the planned budget of 2020, only two of the three budget components can be visualized (see figure above). The two components already available are the cash flow statement (left) and the income statement (right). For the third component (middle, the balance sheet statement), data from the actual spending 2020 will be needed that will be available as of spring 2021.
Assessment of the Practice
The practice can be considered a big success. More than 1,100 municipalities are disclosing their spending data online including several interactive visualizations. It has been awarded several international and national awards and has continuously received media coverage. The platform measures on average 1,400 visits per month.
All 26 municipalities with more than 20,000 inhabitants are on the platform. 971 small municipalities with less than 5,000 inhabitants are using the platform. The smallest municipality only has 41 inhabitants, while the largest one (the City of Vienna) has 1,9 million.
Even though the features of the platform do not differ according to the size, the effects are different: Larger cities who already had a practice of publishing at least the PDF versions of their spending reports on their websites profit more from the benefit of the interactive visualization, while for rural areas, using the platform is most likely to be the first time that they are publishing spending data online at all. Just recently (in June 2020), three small Tyrolean municipalities left the platform due to privacy concerns. It became obvious that the smaller a municipality is, it is more likely that only one person is working in a department. Even though the names of persons are not published in the spending reports, it can be possible to research names of persons working in the municipality from their website and therefore concluded what their wage must be. There is an ongoing discussion among the Austrian Data Protection Authority and the municipal supervisory authority (of the Land Tyrol) about this question, especially because there are regulations in place which indicate that detailed spending data has to be published.
References to Scientific and Non-Scientific Publications
Blöschl R, Hödl C and Maimer A, ‘Mit der VRV 2015 zu mehr Generationengerechtigkeit‘ in Peter Biwald and others (eds), Nachhaltig wirken. Impulse für den öffentlichen Sektor (NWV 2019)
Bröthaler J, Haindl A and Mitterer K, ‘Funktionsweisen und finanzielle Entwicklungen im Finanzausgleichssystem‘ in Helfried Bauer and others (eds), Finanzausgleich 2017: Ein Handbuch (NWV 2017)
Geißler R and Ebinger F, ‘Austria’ in René Geißler, Gerhard Hammerschmid and Christian Raffer (eds), Local Public Finance in Europe. Country Reports (Bertelsmann Stiftung 2019)
Krabina B, ‘Austria Launches Budget Transparency Portal’ (International Budget Partnership, 25 November 2013) <https://www.internationalbudget.org/2013/11/austria-launches-budget-transparency-portal/>
—— ‘Austria’s Award-Winning Open Spending Portal Turns Two’ (Global Initiative for Fiscal Transparency, 1 October 2015) <http://www.fiscaltransparency.net/blog_open_public.php?IdToOpen=3451>
Mühlberger P and Ott S, Die Kommunen im Finanz- und Steuerrecht (1st edn, DBV 2016)
Österreichischer Städtebund (ed), ‘Stadtdialog. Schriftenreihe des Österreichischen Städtebundes, Gemeindefinanzen 2020 – Entwicklungen 2009 – 2023‘ (forthcoming)
[1] Austrian Stability Pact 2012, see <https://www.ris.bka.gv.at/GeltendeFassung.wxe?Abfrage=Bundesnormen&Gesetzesnummer=20008232>.
[2] ‘Klosterneuburg‘ (Offener Haushalt, 28 January 2020) <https://www.offenerhaushalt.at/gemeinde/klosterneuburg>.